
Font size 

Advanced Studies

Accl. Operations

Past Accl. Operations
Accelerator R&D

Theoretical Research
Archives
Visual Imaging of Radio-Frequency Cavity Breakdown
Toward the phase 2 operation of the SuperKEKB project, the construction of the positron damping ring (DR) has entered its final stage. In 2013, we published an article on the completion of the first production version of the radio-frequency (RF) accelerating cavity for the SuperKEKB/DR (Accl. Lab. Topics 2013/10/7). The present article introduces the results of a high-power test of the second production version of the cavity. RF accelerating cavities are roughly divided into two types: super-conducting cavities (operated at very low temperatures) and normal-conducting cavities (operated at room temperature); this article addresses only normal-conducting cavities. In this article, RF accelerating cavities are simply referred to as cavities, and the first and second production versions of the cavities for the DR accelerator are referred to as DR cavities No. 1 and No. 2, respectively.
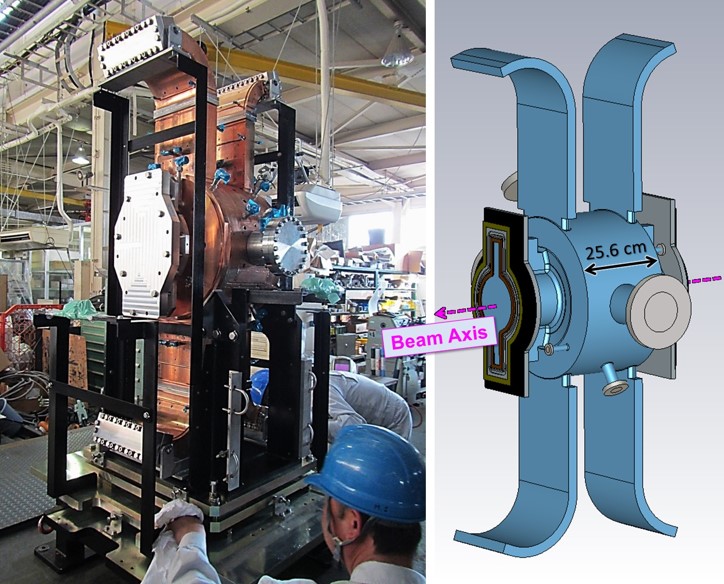 |
| < Figure 1 > RF accelerating cavity for the SuperKEKB positron damping ring (DR). (a) Photograph of DR cavity No. 2. (b) Schematic of the cavity. The blue region is an ultrahigh vacuum during high-power operation. |
Figure 1(a) shows a photograph of DR cavity No. 2, which has the same mechanical structure as that of DR cavity No. 1 and is mainly made of high-purity oxygen-free copper (class 1). During high-power operation, the inside of the cavity is a cylindrical ultrahigh vacuum region, as shown in Fig. 1(b); the cavity is an evacuated metal resonator acting as a heart of the DR accelerator. High‐power RF waves with a resonant frequency of 508.9 megahertz (MHz) are continually fed into the cavity to excite an electromagnetic field of the accelerating mode, as shown in Fig. 2 (technically called TM010 mode).
(a) Electric Field |
(b) Magnetic Field |
| < Figure 2 > (a) Electric and (b) magnetic fields of the TM010 accelerating mode. The scales of the field strengths are arbitrary. | |
The input RF power is used to excite the accelerating mode and for others, and there is almost no reflection from DR cavities No. 1 and No. 2. This accelerating mode has a peak electric field at the central axis, which is the beam axis shown in Fig. 1(b); this field kicks and accelerates positrons (antiparticles of electrons). For the case in which the kinematic energy of a positron increases by a maximum of 1 electron volt after it passes once through a cavity, the accelerating voltage per cavity (hereafter called the “cavity voltage”) is defined as 1 volt (V). For DR accelerator operation, a cavity voltage of 0.70 megavolt (MV = 106 V) is required. The cavity voltage in the hardware specification of DR cavities No. 1 and No. 2 is 0.80 MV, and the highest cavity voltage achieved at the test stand was 0.95 MV. For comparison, the voltage in the power line between a high-capacity electric power plant and a primary substation in Japan is 0.275–0.5 MV at 50–60 Hz. Because the cavity gap length is 25.6 cm, as shown in Fig. 1(b), a cavity voltage of 0.80 MV corresponds to an accelerating gradient of 0.8 MV/0.256 m = 3.1 MV/m.
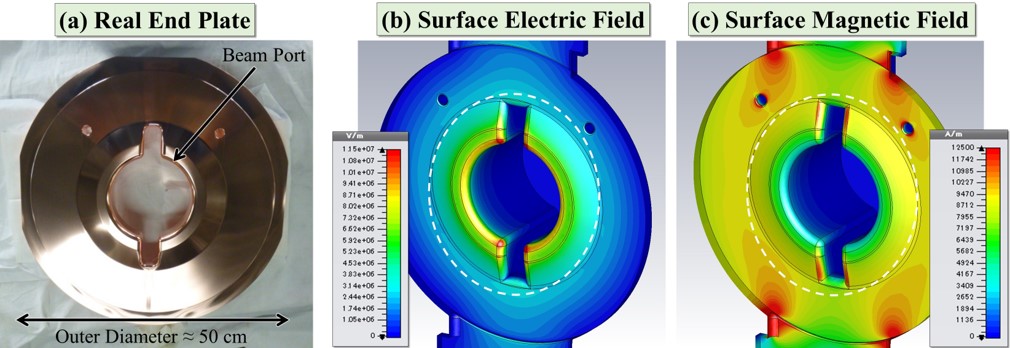 |
| < Figure 3 > (a) Photograph of a cavity end plate. (b) Electric and (c) magnetic surface fields on the end plate at a cavity voltage of 0.90 MV (accelerating gradient: 3.5 MV/m). |
The main bodies of DR cavities were constructed by bonding two discoidal end plates (Fig. 3(a)) and one barrel. Before the bonding, the surfaces of the end plates were electropolished to make them smooth; the final average surface roughness after the electropolishing was approximately 0.2 µm, which is much smaller than the skin depth of copper at 508.9 MHz (approximately 3 µm). When a high RF power is fed into the cavity to excite the accelerating mode, the surfaces of the end plates are exposed to a high electromagnetic field. As an illustrative example, Figs. 3(b) and (c) show the simulation results of the surface fields for a cavity voltage of 0.90 MV (accelerating gradient: 3.5 MV/m), at which the highest surface electric field is 13 MV/m. This maximum electric field is two orders of magnitude lower than that required to induce field evaporation (the ionization of metal surface atoms under a high electric field), which is on the order of a few gigavolts per meter (GV/m = 103 MV/m). However, phenomena called “cavity breakdowns” occur as a result of vacuum discharge during high-power operation at such surface fields (13 MV/m or lower), resulting in total reflection from the cavity. The performance of the cavity is higher when the number of cavity breakdowns per unit time (hereafter called the “cavity breakdown rate”) is lower. The cavity breakdown rate strongly depends on the cavity voltage and increases drastically with small increases in the cavity voltage. This means that it is more difficult to develop and construct a cavity with a higher cavity voltage (or a higher accelerating gradient). It is particularly problematic that the origin and mechanism of cavity breakdown (hereafter called the “cavity-breakdown trigger mechanism”) are unknown despite the many related scientific studies that have been conducted worldwide and the significant findings they have revealed. Therefore, the real performance limit of cavities remains unknown.
For DR cavity No. 1, at the test stand, good performance with a low cavity breakdown rate (one breakdown in 30.5 hours) was demonstrated after the first RF conditioning [1]. For DR cavity No. 2, in addition to demonstrating that its cavity breakdown rate was comparable to that of DR cavity No. 1, a direct in-situ observation of the inner surfaces of the cavity, particularly the surfaces of the end plates exposed to high electromagnetic fields during the high-power test, was performed through the video recordings of light images. These video recordings provide concrete visual evidence of the events associated with cavity breakdown. To observe the inner surface of the end plate, it must be viewed through the beam port (Fig. 3(a)) of the other end plate. However, a television (TV) camera cannot be attached directly to the beam port because the radiation level near the beam axis is high as a result of the presence of dark currents during high-power operation; therefore, a mirror (Fig. 4(a)) was installed inside a mirror chamber to allow the observation of the inside of the cavity through the beam port, as shown in Fig. 4(b). A TV camera was then attached to the viewport of the mirror chamber far from the beam axis, as shown in Fig. 4(c). In the high-power test of DR cavity No. 2, two mirror chambers attached to the upstream and downstream beam ports were used.
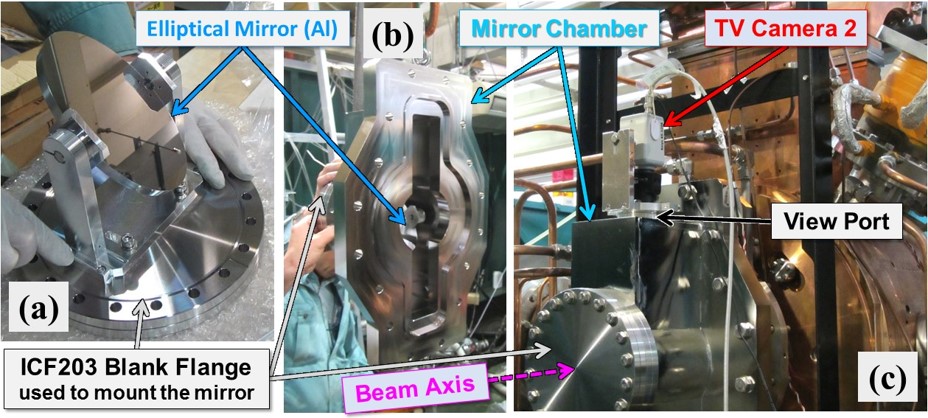 |
| < Figure 4 > Mirror chamber used for the high-power test of DR cavity No. 2. The mirror shown in (a) was located at the beam axis in the chamber, as shown in (b) and (c), to view the surface of the end plate through the beam port. A TV camera was attached to the viewport on the top of the mirror chamber, as shown in (c). |
In addition, a TV camera was attached to the side port of the cavity. A total of three TV cameras were used for the multidirectional and wide-field observation of the inside of the cavity, as shown in Fig. 5.
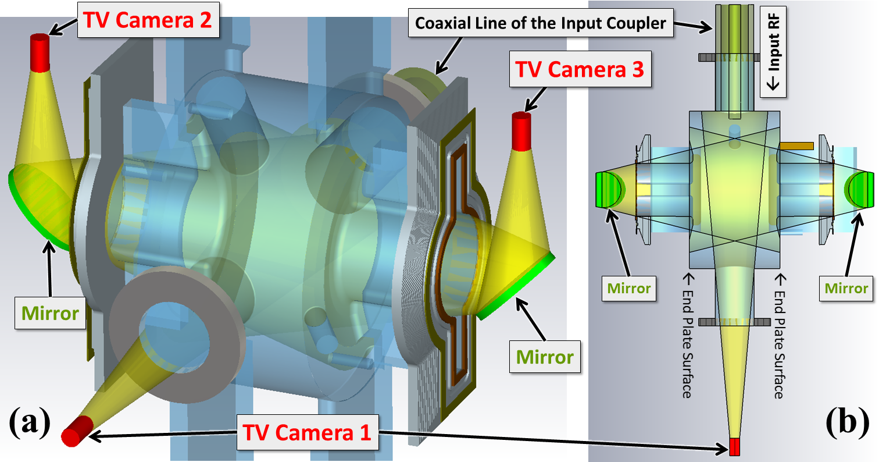 |
| < Figure 5 > (a) Schematic of the setup of the three TV cameras (red cylinders). The yellow conical regions represent the fields of view of the TV cameras. (b) Cross section along the horizontal plane including the center of the cavity. |
The multidirectional observation using the three TV cameras was used to distinguish on which cavity end plate (upstream or downstream) the abnormal emission of light occurred by determining which side was brighter when a cavity breakdown occurred. Videos obtained using the TV cameras were automatically recorded on high-capacity storage devices for exhaustive observation using skip back recorders during the time period from 5 s before the cavity breakdown occurred to 1 s after the cavity breakdown, where the frame rate of the recorded videos was 30 frames per second. To detect cavity breakdowns, the reflection wave level (total reflection in the case of a cavity breakdown) and the pickup waveform of the accelerating mode were used. During the high-power test of DR cavity No. 2, a total of 205 cavity breakdowns were detected.
Can you imagine what phenomena occurred inside the cavity when a cavity breakdown occurred? Because a high voltage was applied across the two end plates, you can imagine pyrotechnic phenomena, such as lightning and flashes. Actually, such phenomena were occasionally observed, as shown in Fig. 6; however, not observed in every case of cavity breakdown; the number of cavity breakdowns accompanied by the observation of such phenomena was only 22 (approximately 10%) of the total of 205 observed cavity breakdowns.
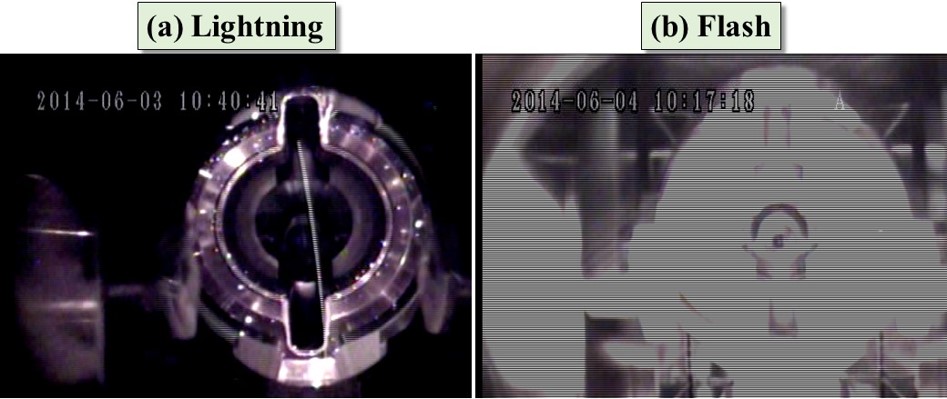 |
| < Figure 6 >Examples of events accompanying cavity breakdowns. (a) Lightning and (b) a huge discharge were observed by TV camera 3 at the moment of cavity breakdown. In both cases, the cavity voltage was 0.89 MV. Download links for the video files: (a), (b). |
The major events were then clarified and classified into two types. The first type is cavity breakdowns accompanied by small spot-type explosions (hereafter simply referred to as “explosions”), as shown in Fig. 7. The number of observed events of this type was 81 (approximately 40%) of the total of 205 cavity breakdowns. In these events, an explosion occurred on the end plate although nothing was present near the explosion point before the cavity breakdown. Fast explosions were recorded only in one frame, and some slow explosions were recorded in up to dozens of frames. The dynamics of the explosion are unknown and interesting.
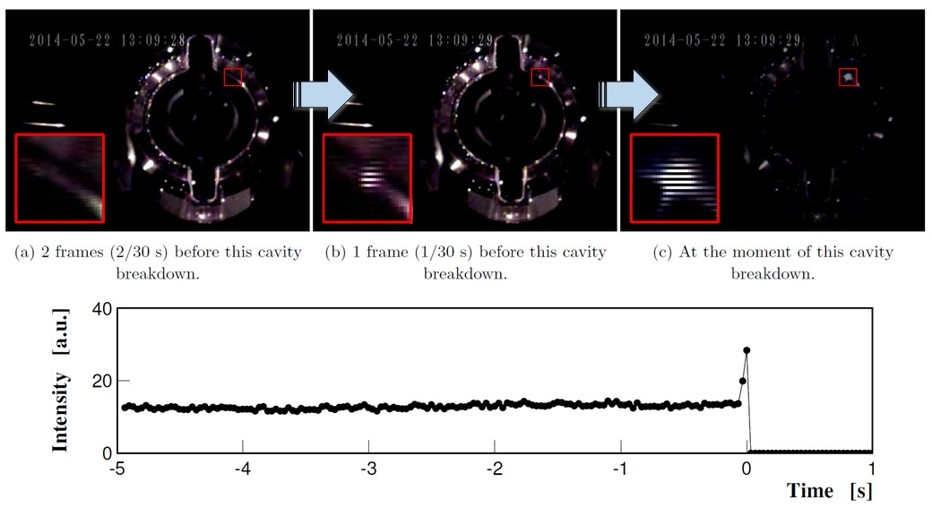 |
| < Figure 7 > Example of a cavity breakdown accompanied by a spot-type explosion at a cavity voltage of 0.56 MV. The insets in the photographs of the end plate in (a)–(c) are magnified views of the region outlined by a red square. (d) Temporal evolution of the intensity of the region outlined by a red square, where the origin of the horizontal axis is the time at which this cavity breakdown occurred. A clear spike in the intensity was observed in two frames, coinciding with the moment of cavity breakdown. Download link for the video file. |
The second type of major event was cavity breakdowns accompanied by an explosion and the disappearance of a stable bright spot on the end plate; a stable bright spot is defined as a bright spot that maintains its intensity for a long time with no effect on the accelerating mode during high-power operation until the cavity breakdown occurs. The number of observed events of this type was 51 (approximately 25%) of the total of 205 cavity breakdowns. An example of such an event is shown in Fig. 8.
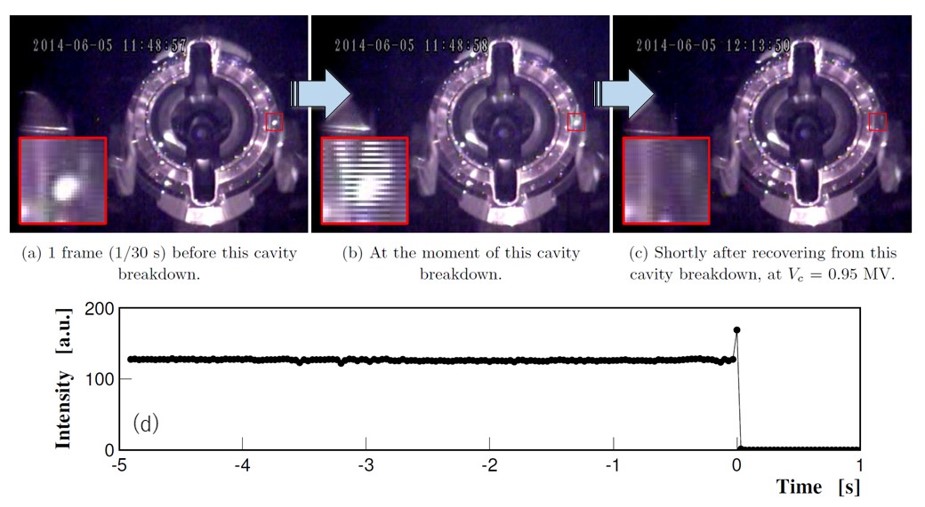 |
| < Figure 8 > Example of a cavity breakdown accompanied by an explosion and the disappearance of a stable bright spot at a cavity voltage (Vc) of 0.95 MV. The insets in the photographs of the end plate in (a)–(c) are magnified views of the region outlined by a red square. (d) Temporal evolution of the intensity of the region outlined by a red square, where the origin of the horizontal axis is the time at which this cavity breakdown occurred. A clear spike in the intensity was observed in one frame, coinciding with the moment of this cavity breakdown. Download link for the video file. |
After the explosion, no bright spot appeared at the position of the explosion even if a high RF power was fed into the cavity. Because of the explosion and the disappearance of a stable bright spot, the number of stable bright spots on the end plates decreased during high-power operation, as shown in Fig. 9. The images in Fig. 9 were captured during stable high-power operation, not during cavity breakdown.
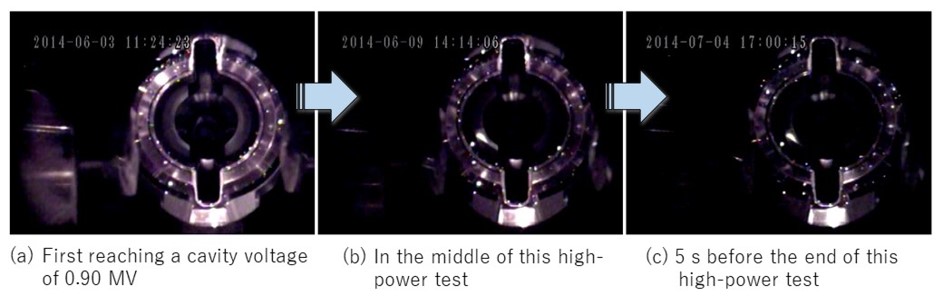 |
| < Figure 9 > Reduction in the number of stable bright spots on the end plate over time at a cavity voltage of 0.90 MV. |
The number of stable bright spots decreased as time passed, and the overall intensity of the bright spots continually decreased. It has been long known that such stable bright spots are present on the inner surfaces of cavities during high-power operation with no effect on the accelerating mode; however, it has been demonstrated for the first time in this test that stable bright spots may be an origin of cavity breakdown, indicating that such bright spots hold the key to elucidating the cavity-breakdown trigger mechanism. Both the shape and composition of these bright spots are unknown, though it is speculated that they may be copper protrusions or dust particles; these characteristics are interesting and may be the subject of future research.
In this study, the exhaustive direct in-situ multidirectional observation of cavity breakdown events was systematically performed through video recordings during high-power operation, providing, for the first time, major visual images of the inside of the cavity for cavity breakdown events driven by the accelerating mode. The results of this study provide a new direction for investigation into the cavity-breakdown trigger mechanism and have recently been published in the scientific journal Physical Review Accelerators and Beams [2]. We are currently preparing an advanced study using higher-specification cameras, as well as working toward the phase 2 operation of the SuperKEKB project.
References (scientific papers, etc.)
[1] T. Abe, Y. Takeuchi, T. Kageyama, H. Sakai, and K. Yoshino, “High Power Testing of the RF Accelerating Cavity for the Positron Damping Ring at SuperKEKB”, in Proceedings of the 10th Annual Meeting of Particle Accelerator Society of Japan, August 2013, Paper ID: SAP057 (15MB PDF).
[2] T. Abe, T. Kageyama, H. Sakai, Y. Takeuchi, and K. Yoshino, "Breakdown Study Based on Direct In-Situ Observation of Inner Surfaces of an RF Accelerating Cavity during a High-Gradient Test", Physical Review Accelerators and Beams 19, 102001 (2016).
・Preprint: KEK Preprint 2015-25 (25MB PDF)
・Presentation at the 11th Annual Meeting of Particle Accelerator Society of Japan, August 2014, Paper ID: SAP050 (10MB PDF)
・Presentation at the 5th International Workshop on Mechanisms of Vacuum Arcs (MeVArc 2015held in Finland) Slide file (13MB PDF)
・Presentation at the International Workshop on Breakdown Science and High Gradient Technology (HG2015held in Tsinghua University, Beijing, China): Slide file (18MB PDF)
- Author: Accelerator Division III, Tetsuo ABE -
| Copyright(c) 2008, HIGH ENERGY ACCELERATOR RESEARCH ORGANIZATION, KEK 1-1 Oho, Tsukuba, Ibaraki 305-0801 Japan |
|web-acc |